 BCBSAcademy
Enrolment options
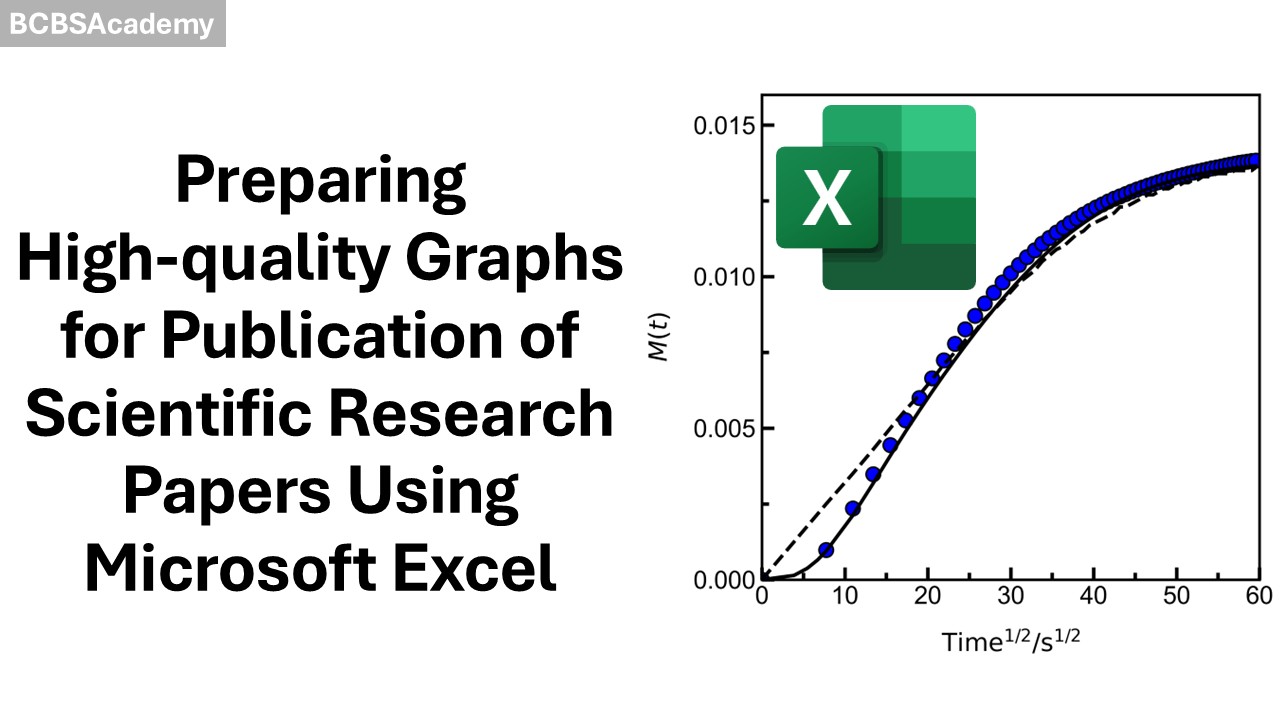
Preparing high-quality graphs for publication of scientific research papers using Microsoft Excel
Course cost: $11.50 or ₦15,000 (individuals); $499.50 (institutions)
Course duration: 1h: 20 min
Course description
Preparing high-quality graphs is the first critical step
towards preparing a scientific research paper for publication. However, there
is limited training on creating high-quality graphs for this purpose.
Consequently, many researchers publish research papers with low-quality graphs
that are difficult to read and understand, which reduces the impact of the
findings. In some cases, competent reviewers suggest improvement of low-quality
graphs before publication while in other cases, they reject the manuscript.
Both cases delay the publication of the paper and reduce the productivity of
the author(s).
High-quality graphs can be created with a wide range of different software
including MATLAB, SCILAB, Python, Julia, Origin and Microsoft Excel once a
researcher learns the fundamental principles underpinning data visualization in
science. Microsoft Excel is a good place to start learning and practicing these
principles because (i) it is readily available to users with Microsoft Office, (ii)
does not require the knowledge of coding and (iii) can be quickly learnt.
Therefore, this course is designed to enable learners gain practical skills on
creating high-quality graphs in Microsoft Excel for scientific publications,
which can be applied in other software for the same purpose.
The course covers types of graphs and their uses, differences between low- and
high-quality graphs, strategies for creating high-quality graphs in Microsoft
Excel, grouping and saving the graphs for publication. Therefore, after
successful completion of the course, the learner will be able to readily select
the type of graph to use for a given dataset and create high-quality graphs
using Microsoft Excel for scientific publications. Additionally, the learner
will be awarded a certificate, which can add value to their CV.
The course will benefit postgraduate/graduate students, postdocs and
early-career researchers in physical sciences, engineering, biomedical
sciences, and other related fields. For postgraduate/graduate students, the
course will help them prepare high-quality graphs for their dissertations or
thesis.
Course access: 21 days (individuals); 1 year (institutions)
Subscribe to receive regular newsletters
Get updates about new courses, events, and announcements!


 BCBSAcademy